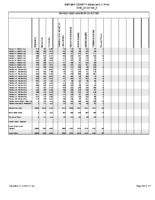
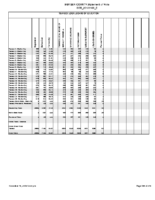
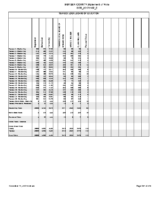
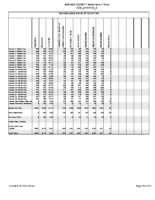
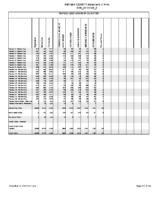
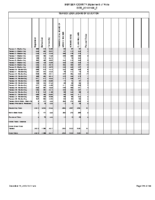
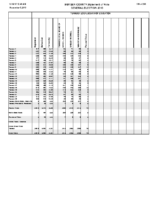
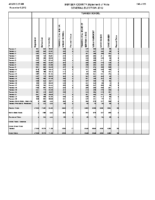
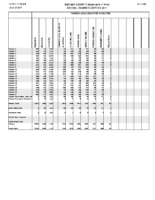
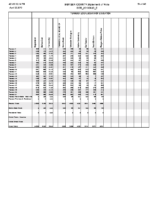
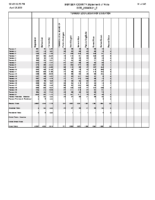
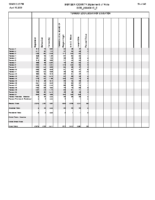
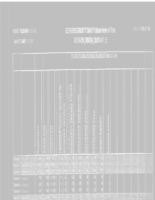
Here is the full chart for Election Data since moving BOE elections to November:
| Year | Adjusted Turnout | # of Voters | % Turnout | BOE Votes Cast | Potential BOE votes | Undervotes | Votes Cast / Votes Possible |
|---|---|---|---|---|---|---|---|
| 2012 | 23.51% | 19,375 | 71.38% | 19,147 | 58,125 | 38,978 | 32.94% |
| 2013 | 9.59% | 10,991 | 42.91% | 7,373 | 32,973 | 25,600 | 22.36% |
| 2014 | 12.02% | 11,389 | 45.17% | 9,091 | 34,167 | 25,076 | 26.61% |
| 2015 | 13.84% | 6,518 | 24.98% | 10,833 | 19,554 | 8,721 | 55.40% |
| 2016 | 25.13% | 20,152 | 70.39% | 21,581 | 60,456 | 38,875 | 35.70% |
| 2017 | 12.28% | 10,892 | 40.84% | 9,827 | 32,676 | 22,849 | 30.07% |
| 2018 | 32.63% | 17,450 | 64.97% | 26,292 | 52,350 | 26,058 | 50.22% |
| 2019 | 19.29% | 7,908 | 26.64% | 17,182 | 23,724 | 6,542 | 72.42% |
