Want to play with the data from the election and share your thoughts? Here it is:
The entire spreadsheet can be found here (see sheet 2 for more detailed breakdown shown below).
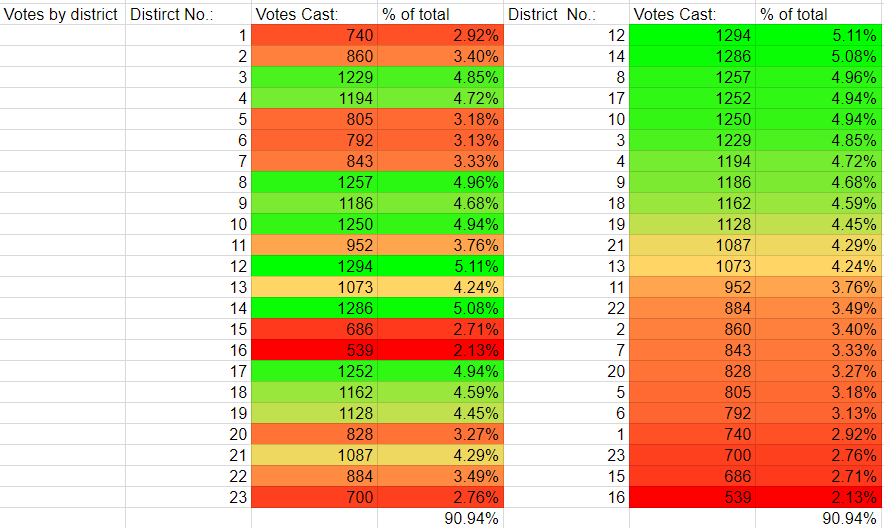
For each column below, the district has been color coded (from Green = highest number of votes per district to Red = lowest number of votes per district.
UPDATE: a new column has been added with “vote-by-mail” numbers:
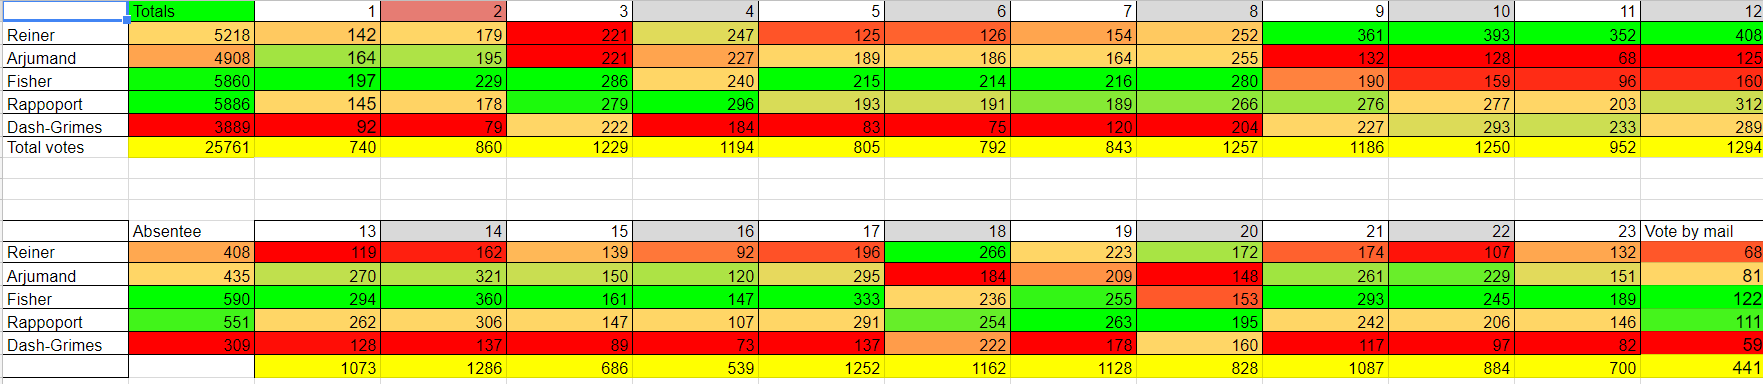
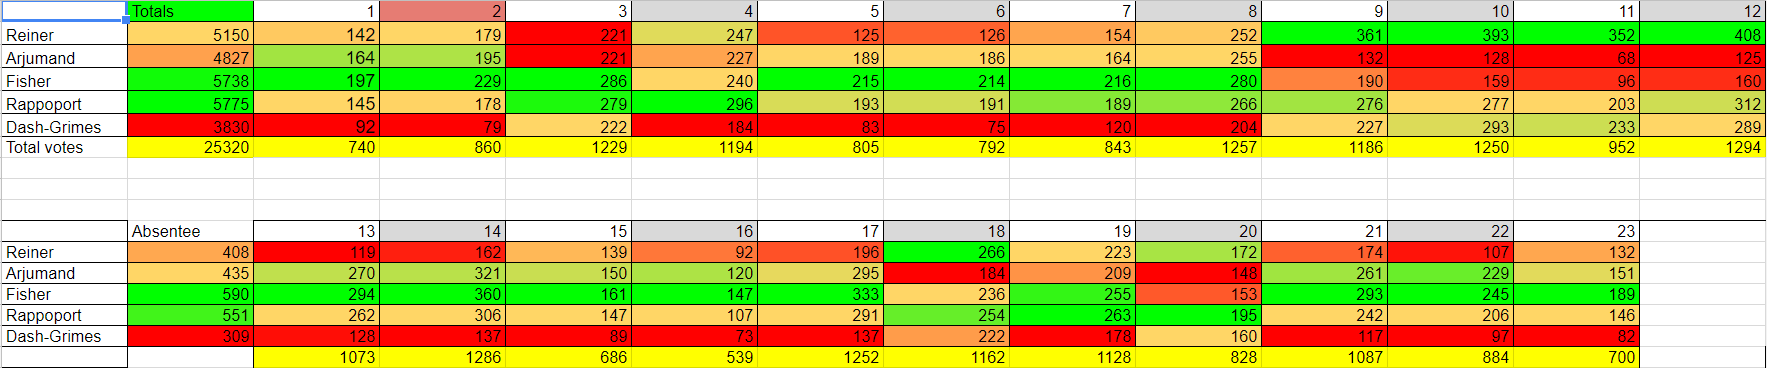
Here is the district by district comparison for where the 25,320 School Board votes were cast. As a reminder, each voter could have cast 1, 2 or 3 votes on election day. These are the totals per district only. They do not indicate how many candidates were voted for by each individual voter.
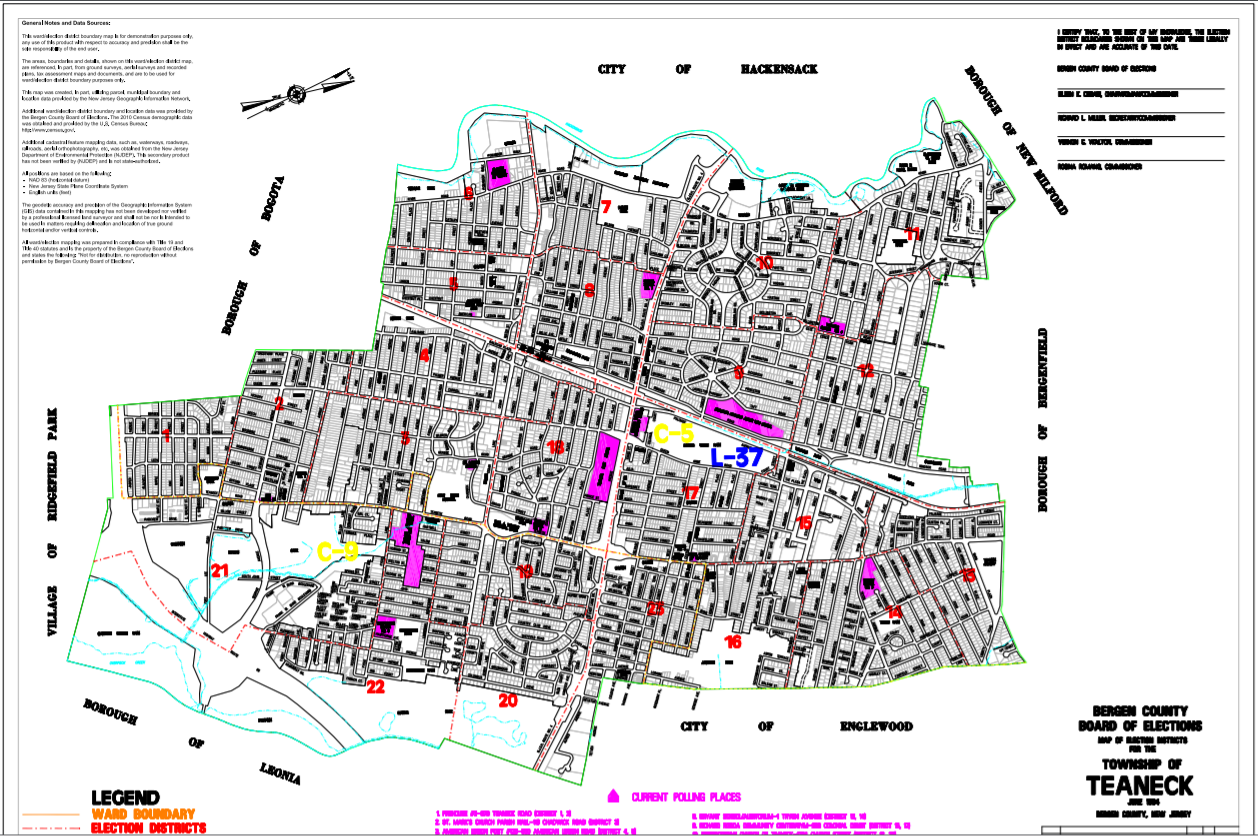
Finally, here is the voting map for Teaneck so you can see where each election district is located (detailed pdf version).