The questions I raised about the referendum to move Teaneck’s non-partisan Council elections to November, should be looked at carefully.
1) Does moving the elections increase turnout and reduce costs?
2) What has happened in places that moved elections to November?
One argument put forward is that the BOE has already done this.
Let’s take a look at the data.
Did moving the BOE vote from April to November drive up turnout?
Not every November election is the same. Let’s examine the three basic types of November elections:
- Presidential election years
(I looked at 2016, a very large turnout election since 2020 was vote-by-mail & very abnormal). - Even year non-Presidential elections
(I looked at 2018 for this type of race – note: 2014 was uncontested) - Non “even-year” elections
(I looked at 2019 for this type of race, although the data is similar in 2017 and 2015)
The Data
For each type of November election, I looked at three metrics:
- Number of Voters: What was the total turnout?
- Number of Votes (expected): How many BOE votes could have happened (# of Voters x 3 positions available)?
- Number of BOE Votes (cast): How many BOE votes did voters use for BOE candidates?
This chart represents the results:
| 2016 | 2018 | 2019 | |
|---|---|---|---|
| Voter Turnout | 20,152 | 17,450 | 7,908 |
| Possible BOE votes | 60,456 | 52,350 | 23,724 |
| Actual BOE votes | 21,581 | 26,292 | 17,182 |
| Unused votes | 38,875 | 26,058 | 6,542 |
| % of Turnout NOT voting for BOE | 64.3% | 49.8% | 27.6% |
| Number of voters skipping BOE | Up to 12,958 | Up to 8,686 | Up to 2,180 |
So, does turnout go up?
A little bit and no.
April Elections ONLY had BOE elections.
Voting turnout was fairly constant (with slightly higher turnout for contested races and slightly lower turnout for uncontested races).
November election turnout largely depends on the type of year. Presidential Election years have much higher turnout than others years and “even” years (e.g. 2018) have higher turnout than “odd” number years (e.g. 2017 or 2019).
Important: Turnout doesn’t translate down the ballot to BOE.
The vast majority of November voters will not pick anyone for Board of Education.
It’s true that there were more people VOTING in November elections than when the BOE elections were held in April.
BUT, the number of people voting in the election isn’t the whole story, as most people voting in November elections SKIP the BOE choices altogether.
DATA:
Let’s examine the data, remembering that the reasons underlying the decision to move these elections revolve around money and turnout.
A note: We can’t know which voters voted in the BOE election (as the vote is anonymous), but we do know how many people vote and how many votes are cast.
Example:
- 5 BOE candidates
- 3 BOE trustee positions
- 100 voters
If 100 people vote in the election, we have the capacity to see 300 votes for BOE candidates (each voter can choose 3 candidates in the BOE election, so 100 x 3 = 300).
The difference between the 300 potential BOE votes in our hypothetical, and the actual number of votes received, is called the “undervote”.
(some will use only 1 or 2 votes (bullet voting), while some will skip the election entirely – but if most people skip the election altogether, we can see the large number of “undervotes” in the data. And we do)
By calculating the undervote, we can get a sense as to how many people skipped the BOE section entirely.
Here’s how the undervote looked for the elections in the chart above:
2016 November Election in Teaneck
Presidential election years, generally see the highest turnout and 2016 was a very high turnout year here and beyond. As 2020 was a very odd year in terms of vote by mail and the pandemic, this will be the best year to see what the effect of major turnout is on a BOE non-partisan race. So what happened?
In November of 2016, Teaneck residents flocked to the polls. 20,152 residents voted in that election, which also had a space for the non-partisan Board of Education.
Potential BOE votes for 2016: 20,152 voters could have cast 60,456 votes (3 per voter).
Number of BOE Votes cast for 2016: 21,581
What happened to the other 38,875 BOE votes?
No doubt, some people voted for 1 or 2 candidates only (bullet voting), but that would only be a portion of those. The fact of the matter is that moving the election to November saw massive increases in turnout, but that did not translate into up to 20,152 people voting for the BOE candidates.
In short, the turnout argument didn’t happen.
2018 November Election in Teaneck
In 2018, there were several races of interest, but as a non-Presidential voting year, 2018 saw less interest in terms of turnout than 2016.
Nevertheless, Teaneck saw 17,450 voters in that election, which also featured the non-partisan Board of Education race.
Potential BOE votes for 2018: 17,450 voters could have cast 52,350 votes (3 votes per voter).
Number of BOE Votes cast for 2018: 26,292 votes cast.
What happened to the other 26,058 BOE votes?
No doubt, some people voted for 1 or 2 candidates only (bullet voting), but that would only be a portion of those. The fact of the matter is that moving the election to November saw increases in turnout, but just like 2016, that did not translate into up to 8,686 people voting for the BOE candidates.
NEARLY HALF (49.8%) of the voters decided to skip the BOE section of the ballot.
2019 November Election in Teaneck
Non-even year November Ballots are very low turnout elections. The only people voting either really like to vote, feel a certain civic duty or know something about the race.
As such, turnout is the lowest of the three types of November elections listed.
In 2019, Teaneck saw 7,908 votes go to to the polls, which also had a space for the non-partisan Board of Education.
Potential BOE votes for 2019: 7,908 voters could have cast 23,724 votes (3 per voter).
Number of BOE Votes cast for 2019: 17,182 votes cast.
What happened to the other 6,542 BOE votes?
Result: A record low number of people in an off-year November election and even still, among the die-hard voters that came out for uncontested races, 27.6% of the votes for BOE, which WAS contested, never happened.
No doubt, some portion of residents voted for 1 or 2 candidates only (bullet voting). That doesn’t explain 38,875 undervotes for an election like 2018.
The fact of the matter is that moving the election to November saw few increases in turnout.
Conclusion:
While it’s unclear why people choose to stay home or vote in April or May elections, it’s not a matter of access. The access to the polls is equal for everyone in April, May, and November. There’s no systemic reason why someone wouldn’t vote in April or May, if they wanted to do so.
Before moving BOE elections to November, April turnout was:
- 2011: 21.26%
- 2010: 39.05%
- 2009: 18.19%
- 2008: 10.11% (uncontested)
- 2007: 15.08%
What did turnout look like after moving the BOE elections?
I’ll put all the information here, so you can pick apart the data.
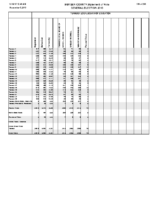
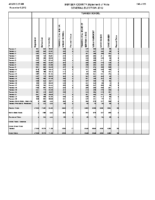
Using similar metrics for the data above, here are all Nov. elections from 2012 (when we moved BOE elections away from April) to the present:
See comment2 below for where this data came from
| Year | Adjusted Turnout | Notes |
|---|---|---|
| 2012 | 23.51% | 4 candidates |
| 2013 | 9.59% | uncontested |
| 2014 | 12.02% | uncontested |
| 2015 | 13.84% | 5 candidates |
| 2016 | 25.13% | 6 candidates |
| 2017 | 12.28% | uncontested |
| 2018 | 32.63% | 5 candidates |
| 2019 | 19.29% | 5 candidates |
Presidential Election Years:
- 2012: 23.51%
- 2016: 25.13%
Even-numbered (non-Presidential) years:
- 2014: 12.02%
- 2018: 32.63%
Odd-number years:
- 2013: 9.59%
- 2015: 13.84%
- 2017: 12.28%
- 2019: 19.29%
Odd-numbered years: There’s no “bump” in turnout.
Even-numbered years: Without a presidential election, one year (2012) went without an increase in turnout and one year (2018) saw turnout increase on par with the turnout we saw in 2010 (which took place in April).
Presidential Election years: This is the only year that saw slightly higher turnout, but it’s within a tiny margin, considering the massive number of additional voters in that election — sadly, most chose not to participate down-ballot.
The argument that moving the vote will increase turnout should be thoroughly examined.
There will certainly be positives and negatives to this move; if the positives do not even materialize, how will they outweigh the negatives?
What are the negatives to moving elections to November?
That will be the topic of the next post as we examine towns that have made this change. Stay tuned.
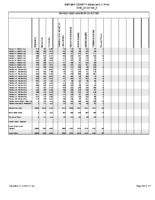
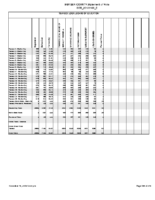
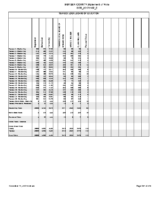
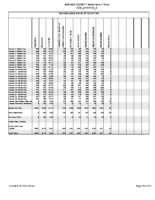
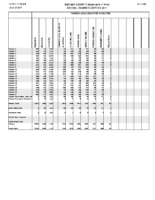
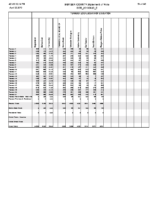
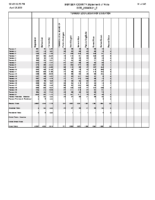
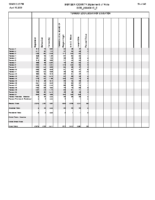
2) To make sense of this in a useful way, I’ve adjusted the data. To do so, I looked at the total turnout in the November election, determined how many BOE votes could have been cast and compared that tally to the number of votes actually cast.
(If you have a better proxy to determine the number of people voting for BOE candidates in November, I’d be happy to run the numbers another way.)
As an example:
Say there were 100 people voting, representing 25% of the registered voters.
We could see UP TO 300 BOE Votes (each of the 100 voters can vote for 3 candidates).
We observe 150 BOE votes.
Half of the potential BOE votes were cast.In that case, I’d multiply the total turnout (25%) by the BOE vote turnout (50%) and get 12.5% (25% x 50%)
2 Replies to “May-November Relationship: Does the turnout argument have merit?”
Comments are closed.