The Teaneck Board of Education hired Whitehall Associates, Inc. to conduct an independent analysis of the effects of new development on the Teaneck Schools. The analysis (available below) projects enrollment based on particular projects and to the overall school system through the 2023-24 school year. Some of the numbers are projections (as the pre-k and K classes haven’t been born yet), but the rest are based on trends and the scientific methodology is outlined in the report and consistent with NJDOE practices.
From the Report:
- Whitehall Associates, Inc. is considered a qualified demographer by the New Jersey Department of Education
- Whitehall Associates, Inc. states that the demographic report it prepared for the Teaneck Board of Education was prepared in
compliance with the appropriate law and administrative code. - Bernard Piaia, at the NJDOE Office of School Facilities, has agreed to accept this report for review and consideration, if it is submitted in its complete final form, with an original signature, along with the NJDOE cohort survival worksheets for the Long Range Facility Plan.\
- The original of this report is on electronic file at the offices of Whitehall Associates, In c. and is available for examination by the appropriate
authorities. - Whitehall Associates was retained by the Teaneck Board of Education to prepare a demographic study for the Teaneck Public School District. The information in this demographic report is suitable for inclusion in any document to be forwarded to the New Jersey Department of Education for matters concerning school facilities.
For those that want the bottom line up front: The Teaneck school enrollment number for total students in 2018-19 is currently 3,504 students.
In 2023-24, that number is projected to be 3,599 students. An increase of 95 students across 13 grades.
The Independent Demographic Analysis Report
(comments in blue appear in the report itself)
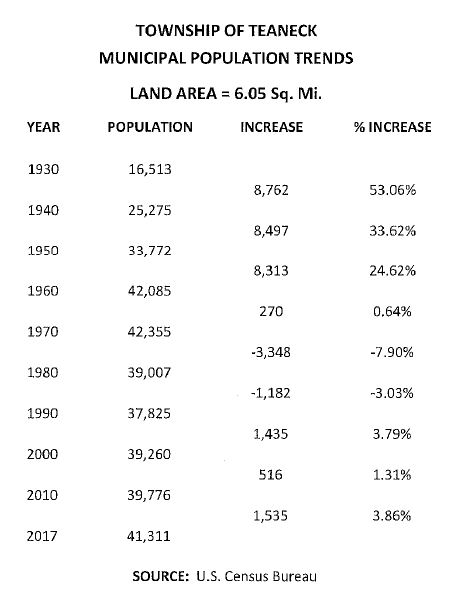 Here is the report. It starts with a population trend estimate for Teaneck. Of interest is that our population has been in decline since the 1960 Census (42,085) and 1970 Census (42,355) to it’s 2010 (39,766 and the current 2017 projection of 41,311.
Table 1
Table 1 starts off with a description of the Pre-School enrollment for Teaneck’s school district. As we just started a new Pre-K program, you will notice that the projected enrollment figures have jumped significantly from the 81 in 2018-19 to 252 for 2019-20. That jump has nothing to do with the current projections in development, but it is relevant to the aggregate number of students matriculating through the Teaneck BoE system, overall.
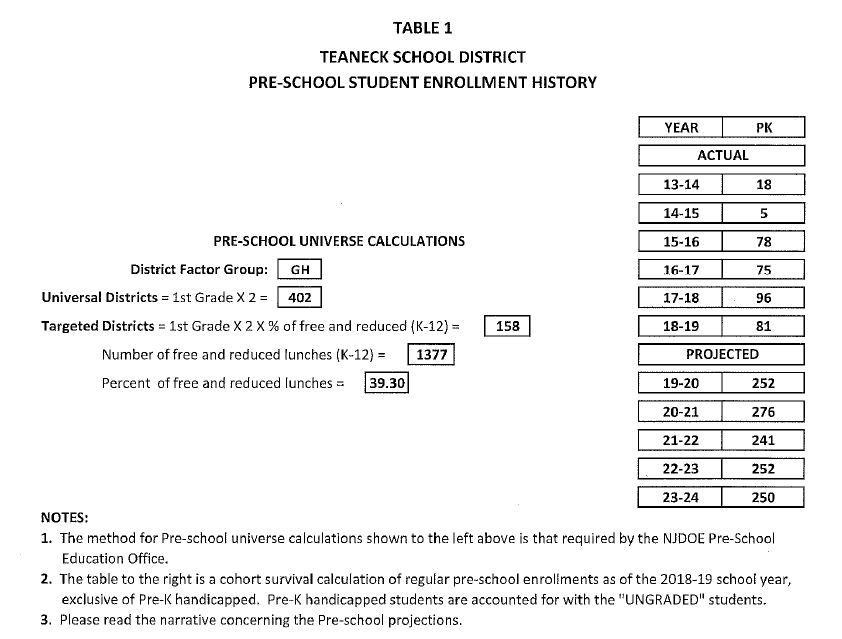 The pre-kindergarten data for the district, both the “universe” and the actual is provided. As of June 13, 2008, The NJDOE promulgated N.J.A.C. 6A-13A which established the ground rules for state funded pre-school programs. One of the factors was determining the”universe”. According to the definitions in paragraph 1.2, “Universe FINAL 2018-19 Demographic Report- Teaneck- 2019/04/10 of eligible three- and four-year-old children” means all three- and four-year-old general education children eligible for preschool pursuant to the School Funding Reform Act (P.L. 2007, c. 260) in a public school district providing a universal or targeted pre-school program. This is different than what was previously used by demographers. Previously, the “universe” was considered the maximum number of students that could be expected to be enrolled in preschool programs. It was generally accepted that this figure would be the live births for that cohort. The NJDOE Data Center now combines the pre-kindergarten figures and list them as PK.
Table 2
Table 2 lists the district’s enrollment history. You can see every grade, with actual enrollment numbers from 2013 through 2019. The district has lost 198 students (5.3%) of the population over the last 5 years. That trend is projected to continue as Table 3 will show..
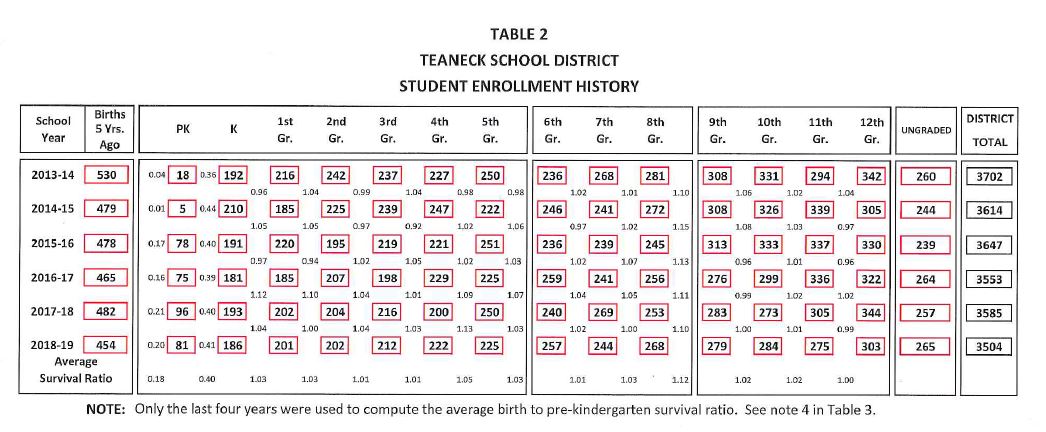 The district’s enrollment history is exhibited wherein the survival ratios mentioned in the preceding paragraphs are developed. Student enrollments used were those provided by the district administration to the New Jersey Department of Education orto Whitehall Associates directly. These figures are for students housed in the district schools and do not include out of district placements. This method is standard and is fully acceptable by the Department of Education and required by law as the source of enrollments. Birth figures were obtained from the Center for Health Statistics of the New Jersey Department of Health (NJDOH). This also is standard and is required by law.
Table 3
Table 3 projects enrollment (by grade) for the Teaneck School District through the 2023-24 school year. It includes the net development of various housing projects (those are listed in Table 4 below) and reflects the addition of 252 students projected for the increase in pre-Kindergarten.
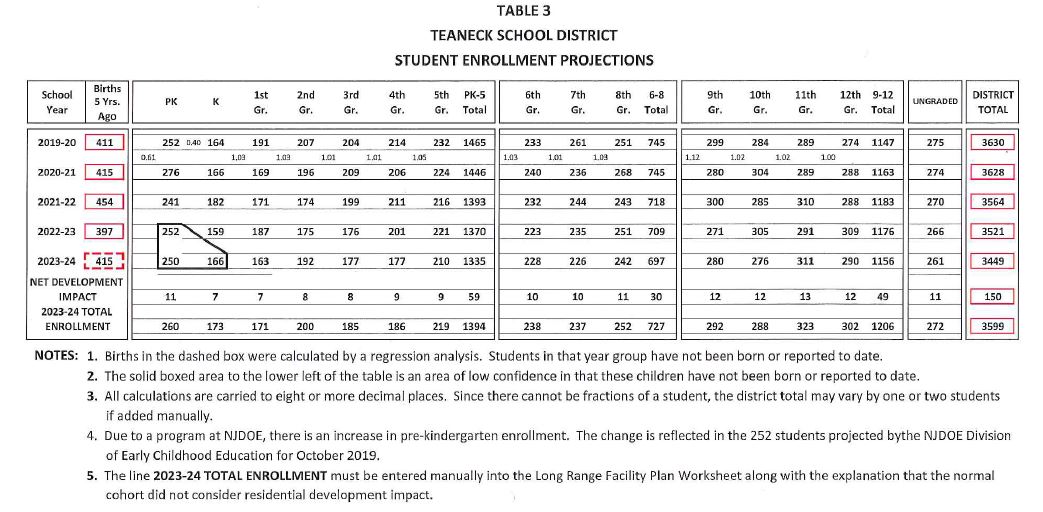 This is the main table and is designed to be used in conferences and meetings and conforms to the NJDOE worksheet. It allows the participant to be able to refer to one page rather than searching through a document for more information. The back-up for Table 3 entries will be found in other tables. All calculations are carried to eight or more decimal places. Since there cannot be fractions of a student, the district totals may vary by one or two students if added manually. These projections can and should be updated every year.
The solid boxed area to the lower left of the table is an area of low confidence in that these children have either not been born or reported. Births in the red dashed boxed area may be shown as a regression, an average of the last eight year’s births, or the last known birth figure. In this case we used a regression analysis.
Table 3 shows the live births attributed to Teaneck five years prior to the kindergarten year shown. Due to a program at NJDOE, there is an increase in pre-kindergarten enrollment. The change is reflected in the 252 students projected for 2019 and subsequent years.
The projection of student enrollment for the next five years has been made. The total school population is expected to decrease by 55 students or 1.56 percent in the next five years, excluding any residential development impact.
Table 4
Here are the Residential Development projects the Township has approved. The list includes a total of 651 apartment units and breaks down the projected number of students by bedroom, with separate lines for affordable rate units and market rate units.
In the example below, for 1500 Teaneck Road, we can see that 126 available 1-bedroom apartments will yield 8 students (approximately 1 student for every 16 apartments). Meanwhile, in the 74 available 2-bedroom market rate apartments, we can expect 20 students (approximately 1 student for every 3 to 4 apartments) and in the 23 available 2-bedroom affordable apartments, we would expect 14 students (approximately 1 student for every 1 to 2 apartments).
This brings a total of 150 additional students for the development listed below. While 100 State Street is not listed as it isn’t yet an approved project, should that be added to the list, assuming the trends listed below, we can expect another modest increase.
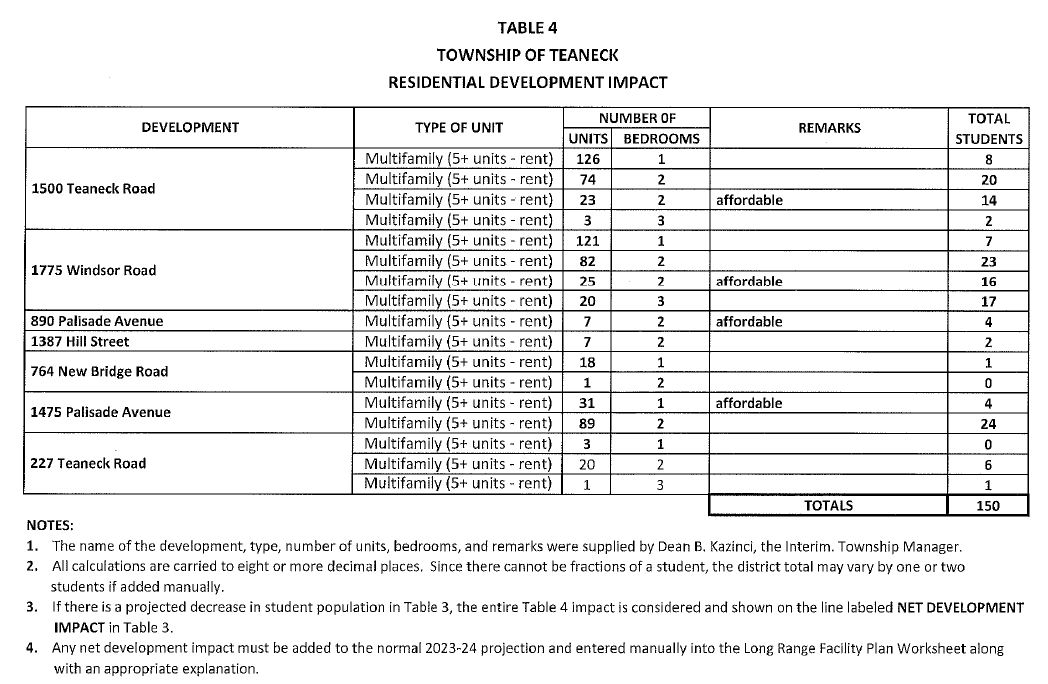
This table shows the population impact of planned and approved residential development in the district. The name of the development, type, number of units, number of bedrooms and remarks were supplied by Dean B. Kazinci, the Interim Township Manager.
We begin with some assumptions. The cohort survival method assumes that the rate of growth during the period the data is collected will remain the same for the period of population projection. Therefore the rate of growth indicated in Table 2 will carry over to Table 3 in all cases. Now if something were to happen that changes the rate of growth, that event must be taken into account. Residential development is one oft hose factors. There are several options at this point:
a. If the development impact in Table 4 is less than the projected FINAL 2018-19 Demographic Report- Teaneck- 2019/04/10 five year increase in student population shown in Table 3, the Table 4 impact is ignored. To do otherwise would be double counting.
b. If the development impact in Table 4 is more than the projected five year increase in student population shown in Table 3, the net impact is shown on the line labeled Net Development Impact in Table 3.
c. If there is a projected decrease in the student population in Table 3, the entire Table 4 impact is considered and shown on the line labeled Net Development Impact in Table 3.
d. If, within the past five years, there has been no development of the magnitude shown in Table 4, the entire Table 4 impact is considered and shown on a line labeled Net Development Impact in Table 3.
Since there is a projected decrease in the student population in Table 3, the entire Table 4 impact is considered and shown on the line labeled Net Development Impact in Table 3.
Usually the Net Development Impact is added to the last year of enrollment projections. This becomes the planning figure for new facilities. It is understood that the developments could contribute additional students throughout the five year period of projections. However, there is no guarantee as to how many students will be
added in any particular year.
Table 5
Table 5 shows the current and projected changes (with development) for the Teaneck School District through the 2023-24 school year. The Total enrollment figures take into account a population decline (“The total school population is expected to decrease by 55 students or 1.56% in the next five years, excluding any residential development impact” see note to table 3), an addition of 250 pre-K students and the impact of projected development.
After all the numbers have been accounted for, the school district will have an additional 95 students in the next 5 years (3504 today vs 3599 projected). The location of the students can be found in the table below.
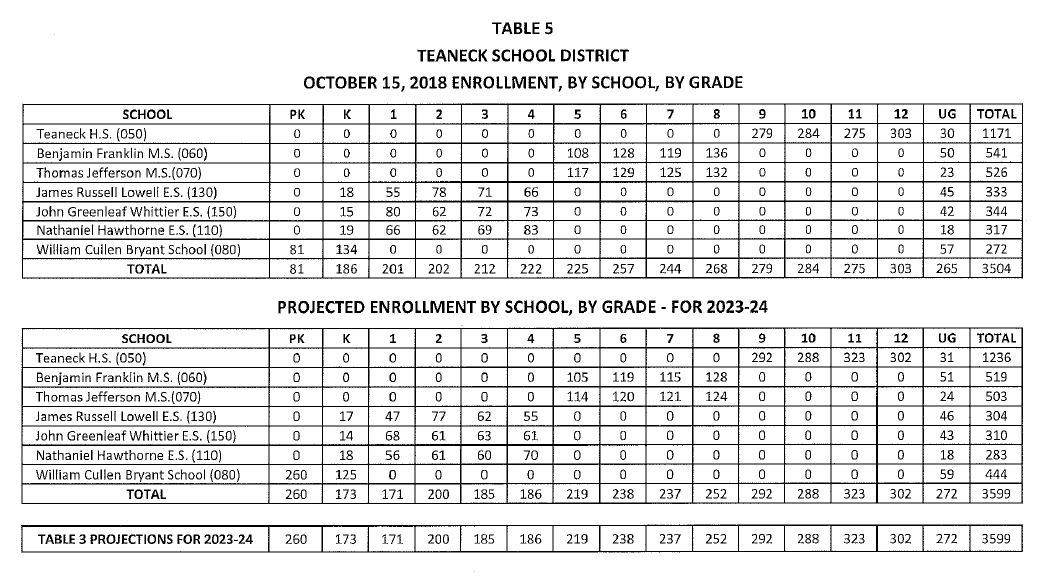 The enrollment projections by school, by grade fort he year 2023-24 are based on enrollment data supplied by the district. The ratio of students was taken from the October 15, 2018 enrollment data, and applied to the 2023-24 district wide projections. This method is required by the NJDOE in the long Range Facilities Plan.
The entire study can be seen here: https://www.teanecktoday.com/blog/wp-content/uploads/2019/05/2018-19-Demographic-Report.pdf.
2018-19 Demographic Report
The forum was held by the Teaneck Democratic Municipal Committee not the Township.
Live streaming and the video were provided by Allison Davis.